
Harvest Yield Analytics (HYA)
The model captures real-time yield results from commercial seed company trial results during the fall harvest season. Yields from seed plot trials are then compared to historical seed plot trials (2020–2024) in the same region and used as a predictor for average county yields. It’s important to note these results are not fully representative of every acre or growing condition, but they provide valuable directional insights into harvest outcomes. Follow Along Weekly with our Harvest Yield Analytics as we track corn and soybean yields this harvest season and compare trends to previous years. This information is part of our weekly email newsletter and you can sign up to receive it in your inbox.
Early Harvest Results Diverge: South Holds Steady, Midwest Lags
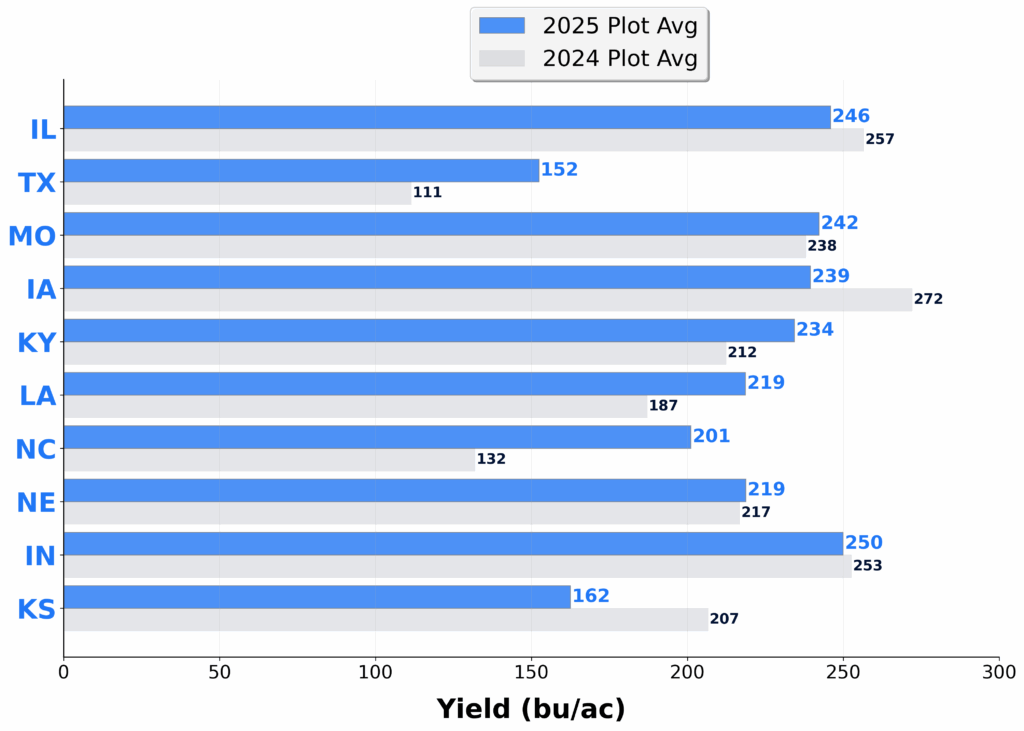
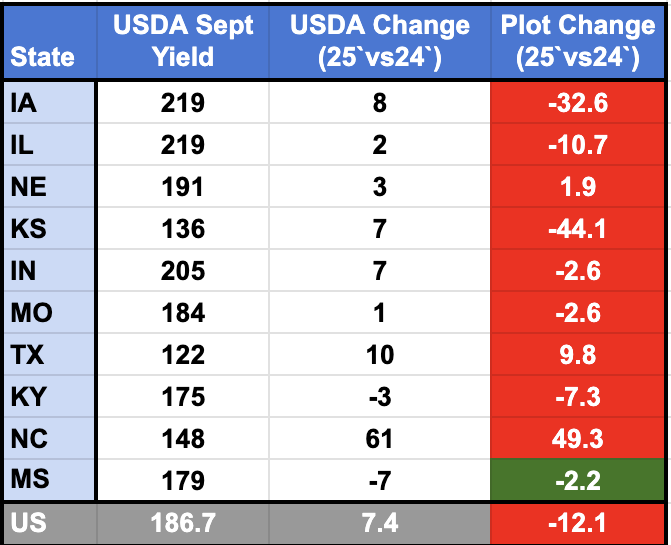
Early harvest results show that southern states such as TX, MS, NC, and KY are tracking closely with USDA’s forecasted yield changes. Iowa and Illinois—the two largest corn producers—are projected to hit record yields of 219 bu/acre, making them critical to achieving USDA’s national record forecast of 186 bu/acre. However, very early harvest data in these states is running below 2024 levels so far. In KS and NE, irrigated acres are still largely unharvested, and as those fields come in, they are expected to lift overall state yields in the weeks ahead.
Seed Plot Yield Changes 25′ vs 24′
Seed Plot Average Yield (Top States)
Sept USDA Forecasts & Seed Plot Change 25′ vs 24′
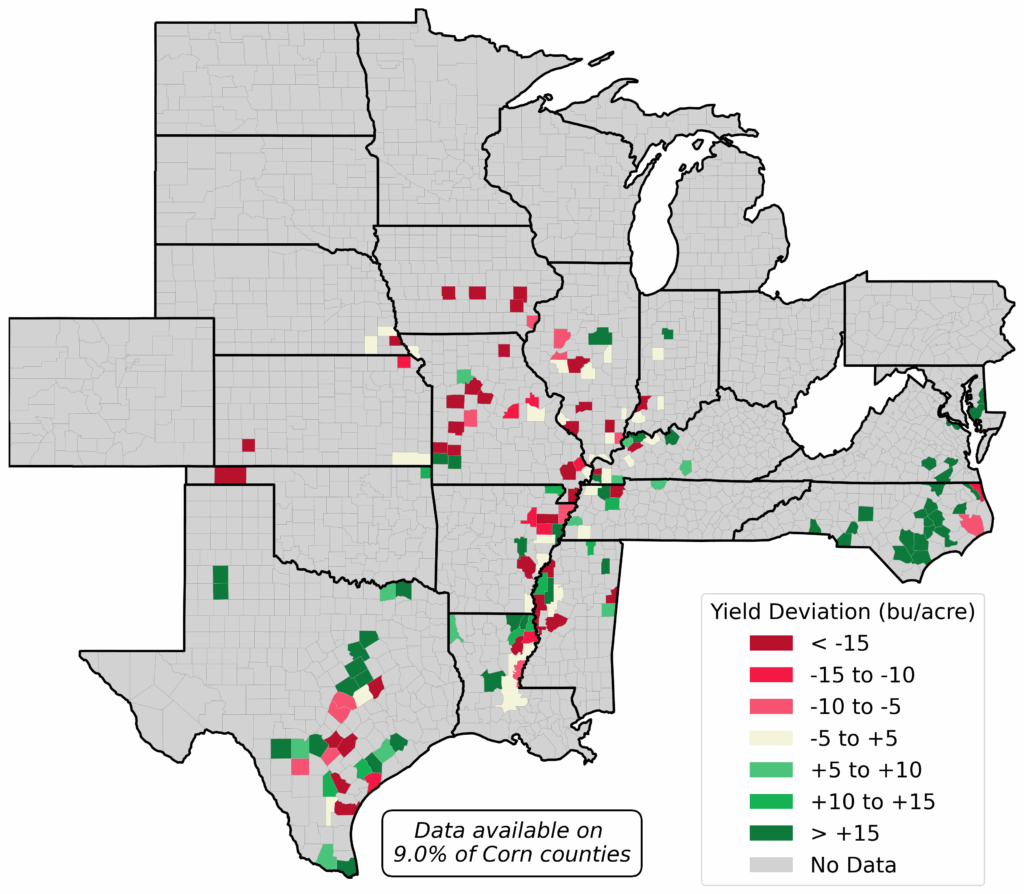
-Data from 385 plot reports thru Sep 17, 2025 as compared to 8,000 in 2024
-Data from the USDA 2025 Report- Sept 11