Corn: Bearish Tilt in the Near Term
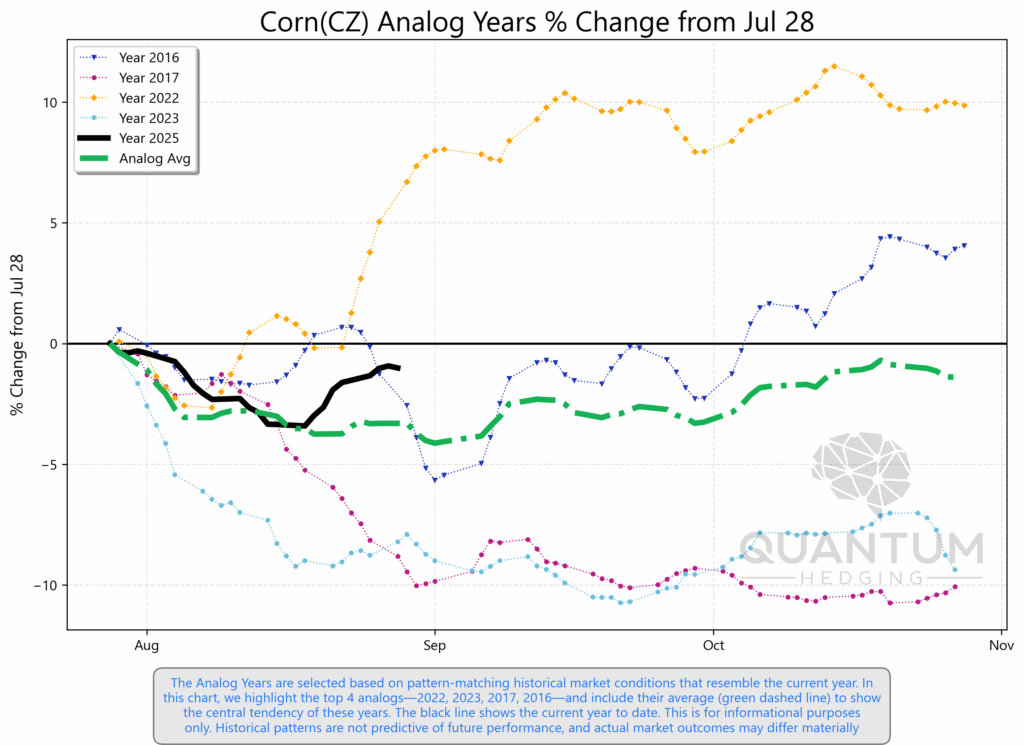
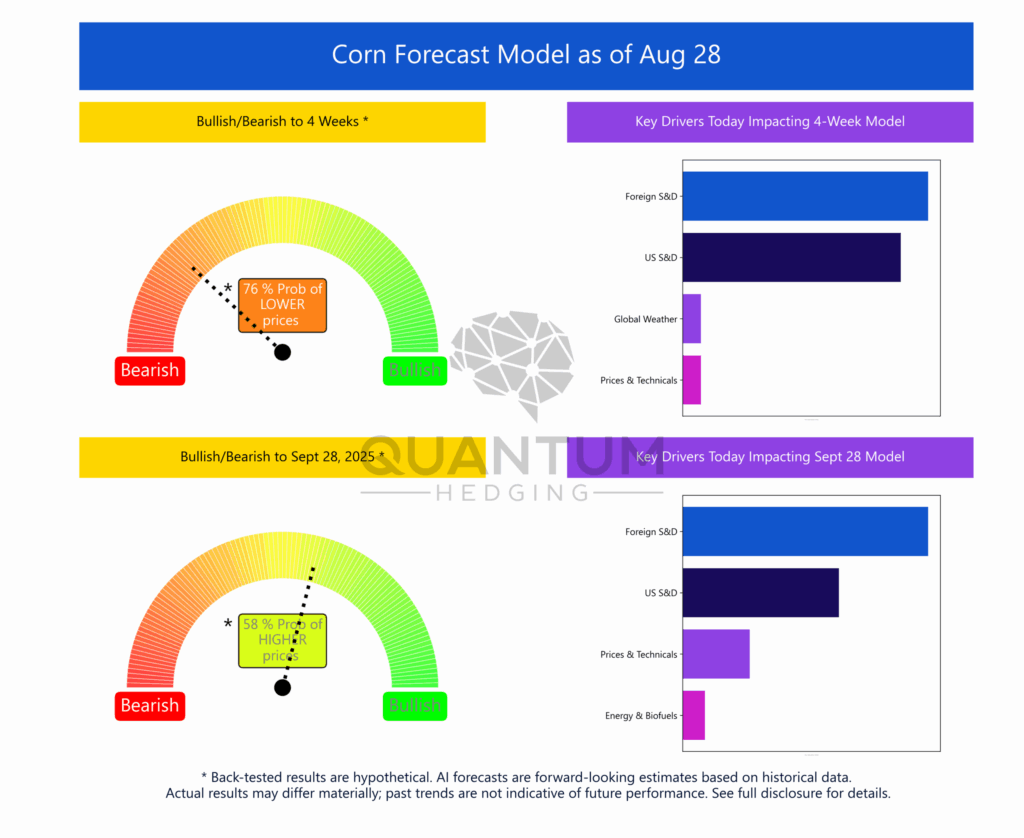
The Quantum Hedging corn model has shifted firmly bearish in the short run, showing a 76%* probability of lower prices over the next 4 weeks. The main drivers are foreign supply & demand and U.S. S&D, both weighing heavily on sentiment, while technicals and weather provide little offset.
Further out into late September, the tone shifts with the model signaling a 58%* probability of higher prices. That leaves the medium-term view more balanced, with potential for stabilization if demand improves or late-season weather trims supply.
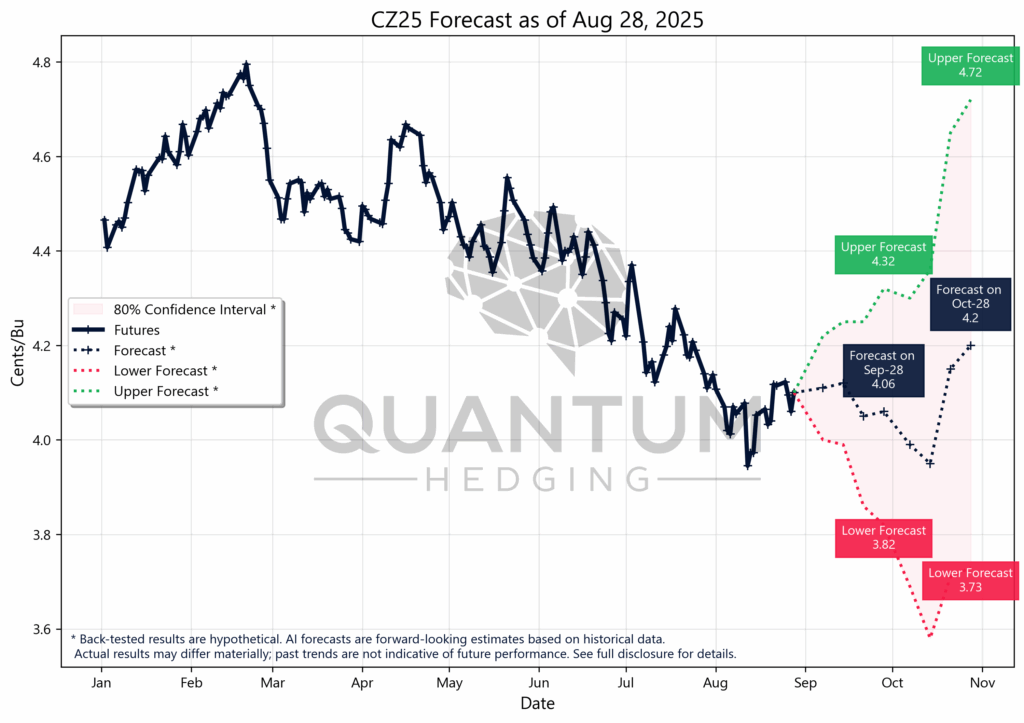
For the remainder of the growing season, corn futures are projected to trade between $3.73* and $4.72*, with the central path hovering around $4.00*. Much will hinge on whether USDA’s yield outlook remains intact — if it does, the softer tone may persist; if not, markets could find support from tighter supply expectations.
Soybeans: Neutral Bias into September
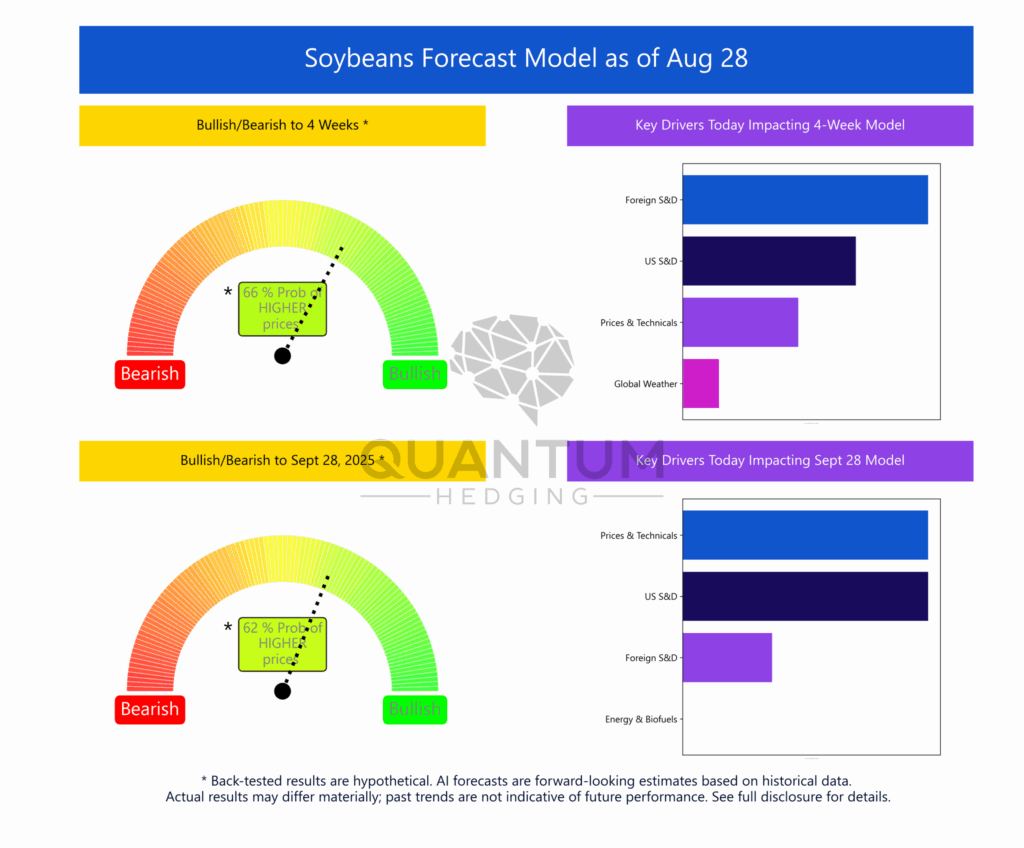
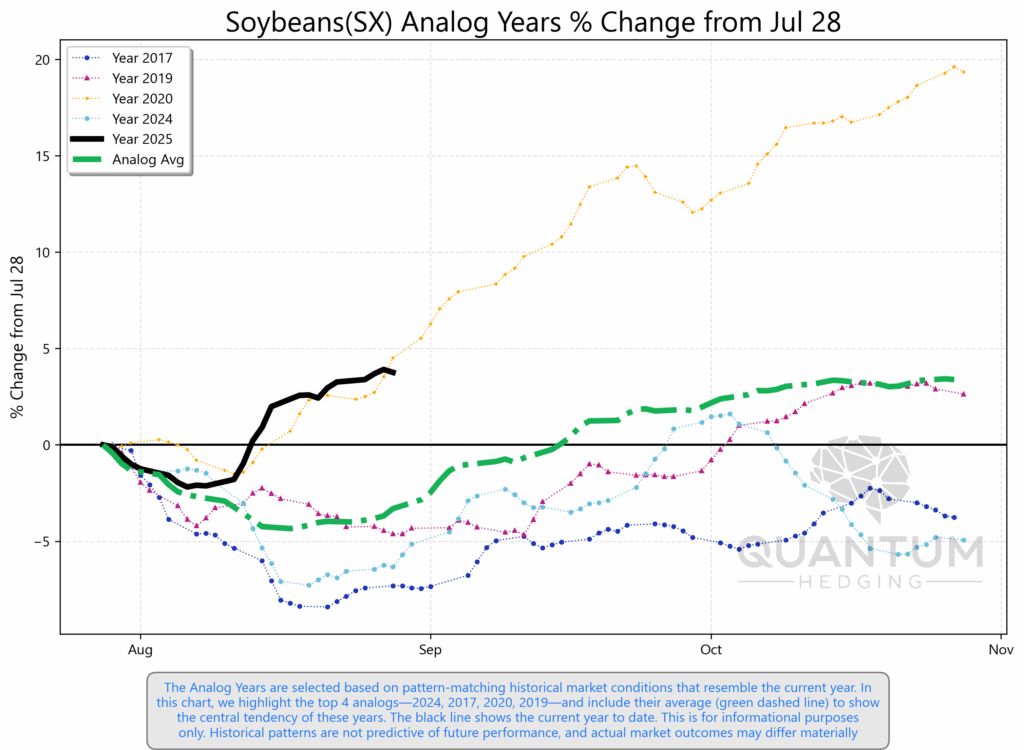
The Quantum Hedging soybean model is pointing to a balanced outlook, with a 66%* probability of higher prices over the next 4 weeks. The signal reflects support from foreign supply & demand and U.S. balance sheet factors, though the conviction is modest compared to past periods of stronger directional alignment.
Looking toward late September, the signal softens further to a 62%* probability of higher prices, leaving the medium-term picture fairly neutral. Prices & technicals remain influential, but the broader driver mix suggests no clear push toward either extreme.
The model’s projections place soybeans between $9.75* and $11.94* through the end of October, with the central path trending close to $10.70*. Much of the balance now rests on whether export demand firms up and whether the U.S. supply outlook continues to hold steady. Absent fresh demand strength, soybeans may stay rangebound as the market weighs strong supply against uneven consumption signals.
QH Model Forecast Hypothetical Trading Results
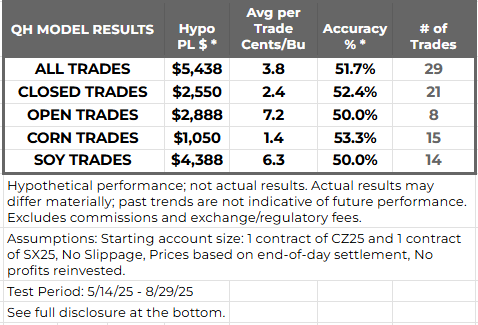
Over the past four months, Quantum Hedging has been publishing weekly forecasts for corn (CZ25) and soybeans (SX25). The table above illustrates the hypothetical outcomes of a simple rules-based trading strategy built around those forecasts, which project one month forward.
Each week, the model produces a directional signal: if the forecasted price is above the current futures, a LONG position is entered the following day at the open; if below, a SHORT position is initiated. Positions are held until settlement one month later. Because this process repeats weekly, multiple overlapping trades can be active at once.
These results reflect how such a strategy could have performed under back-tested conditions. They rely entirely on hypothetical assumptions and do not represent actual trades or live performance.
*Hypothetical performance; not actual results. Excludes commissions and exchange/regulatory fees.
*Back-tested results are hypothetical. AI forecasts are forward-looking estimates based on historical data. Actual results may differ materially; past trends are not indicative of future performance. See full disclosure for details.

