Corn: Modest Lean Higher, but Can It Last?
The Quantum Hedging corn model is signaling a 65%* probability of higher prices over the next 4 weeks, supported mainly by prices & technicals along with U.S. supply & demand. This tilts the near-term outlook upward, though the conviction behind the move remains moderate.
By late September, the signal eases to a 56%* probability of higher prices, leaving the medium-term view more evenly balanced. With the growing season still in play, weather continues to factor into the outlook, though it is not the primary driver at this stage.
Price projections for the remainder of the season place corn futures between $3.48* and $4.42*, with the central path hovering close to $4.00*. The key uncertainty is whether USDA’s yield projections will hold as harvest nears. If they do, the market’s softer tone could persist; if they falter, late-season conditions may lend prices some support.


Soybeans: Leaning Higher, Will Demand Deliver?
The Quantum Hedging soybean model is showing an 85%* probability of higher prices over the next 4 weeks, with support coming from prices & technicals and foreign S&D. This gives the short-term outlook a constructive tilt, though it still carries the usual caveats of a market shaped by export demand and macro volatility.
Looking out to late September, the balance shifts, with the model pointing to a 71%* probability of lower prices. That keeps the medium-term view more cautious, as supply prospects remain strong and export flows have yet to provide firm support.
For the rest of the growing season, soybeans are projected to trade between $9.31* and $11.33*, with the central path tracking near $10.50*. Much depends on whether U.S. and global demand can absorb the crop. If export programs strengthen into harvest, soybeans may hold their upward lean — but if demand stays sluggish, the weight of supply could reassert itself.
QH Model Forecast Hypothetical Trading Results
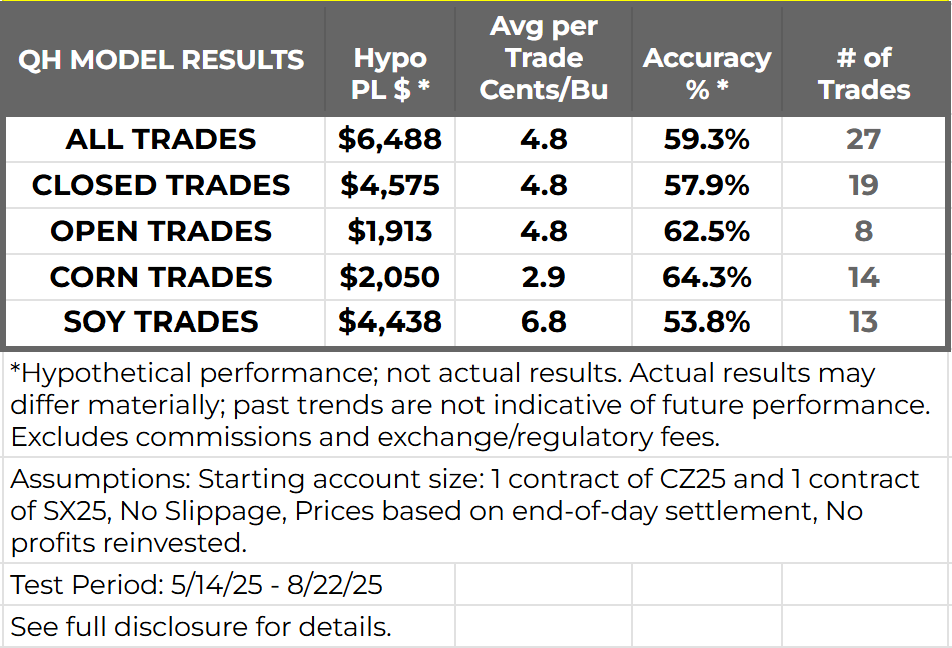
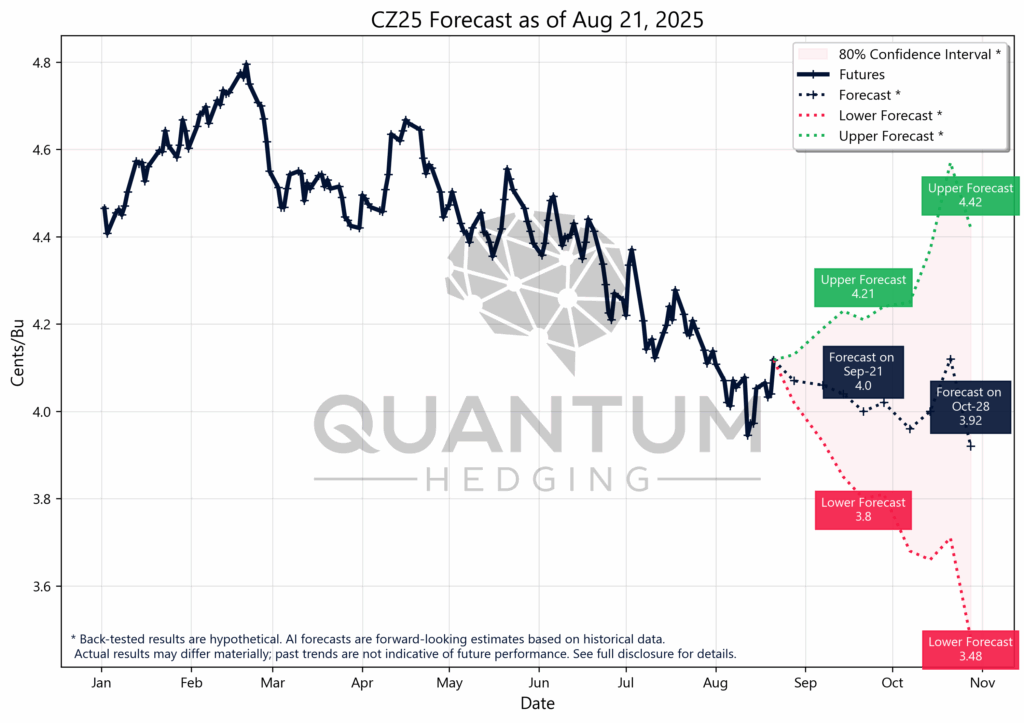
Over the past three months, Quantum Hedging has been publishing weekly model forecasts on corn (CZ25) and soybeans (SX25). The table above shows the hypothetical results of a simple trading strategy built from those forecasts, which look one month ahead. Each week, the model generates a directional view: if the forecasted price is higher than futures, a LONG position is taken the next day at the open; if lower, a SHORT position is initiated. The trade is held until settlement one month later. Because this rolls week by week, multiple overlapping trades can be open at the same time.
The figures illustrate how such a strategy might have performed under back-tested conditions. They are based entirely on hypothetical assumptions and do not represent actual trading activity or live results.
*Back-tested results are hypothetical. AI forecasts are forward-looking estimates based on historical data. Actual results may differ materially; past trends are not indicative of future performance. See full disclosure for details.


